QGIS


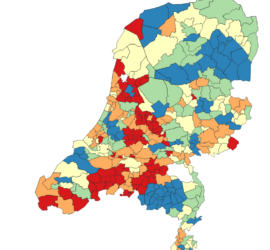
Creating a map of Covid cases per municipality in QGIS

Since the beginning of Covid-19, I’ve from time to time downloaded the official Dutch Covid-19 statistics (available here) and created my own plots, using a Jupyter Python notebook that you can find over on Github. But it’s also interesting to view maps instead of only timeline plots. Unfortunately, the official […]


Useful XYZ tiles for QGIS

One of the data types supported by QGIS are XYZ tiles, i.e. tiled image data in a Pseudo-Mercator projection. By default, QGIS only has OpenStreetMap as tile provider. To do so, you right click on XYZ Tiles in the Browser window and choose Add Connection. You need an URL for […]


Settings the QGIS default coordinate system

By default, QGIS asks you which coordinate system to use when a layer that you add does not have a coordinate system mentioned in its metadata. Unfortunately, this is quite often the case, and can become quite annoying. Chances are that you are using the same coordinate system most of […]


Overriding the QGIS default language

By default, QGIS uses your Windows language as language for the user interface. While this might be desirable to some users, this may also cause two issues: Sometimes, the localization isn’t of the best quality, making it difficult to understand what e.g. a function actually means. If you look for […]


QGIS

There was a time when GIS (geographic information system) was synonymous with ArcGIS, a fact that ESRI could easily exploit to ask high license fees. Luckily, there’s an Open Source project that has matured from humble beginnings to a full-blown GIS suite: QGIS. The feature list is extensive: It supports […]